Infection Cluster Identification Using Symptom Documentation
Nursing homes have outbreak data but can't read it fast enough to act.

Skilled nursing facilities generate the data they need to catch an outbreak days before it becomes a crisis. Most of them just can't read it fast enough. The gap between what's written in the chart and what gets acted on, shift by shift, is the real determinant of whether a cluster gets caught inside the 72-hour window regulators use to define an outbreak, or whether it spreads across a wing before anyone connects the dots.
That window matters because of who lives in these buildings. SNF residents carry a baseline vulnerability to respiratory viruses, SARS-CoV-2, influenza, RSV, that turns a short transmission window into a high-stakes one. Regulators set the outbreak threshold at one lab-confirmed flu case alongside a cluster of two or more influenza-like illnesses within 72 hours. A missed symptom entry on a single overnight shift doesn't just delay recognition a little. It can push detection past the entire reporting cycle, which is a structural failure, not a rounding error. Epidemiological linkage is defined with similar precision: exposure within six feet for fifteen minutes or more, during the seven days before symptom onset. That kind of exactness in the regulation demands equally exact, equally timely documentation on the facility side. And most buildings don't have that.
The King County SNF outbreak and symptom-only screening
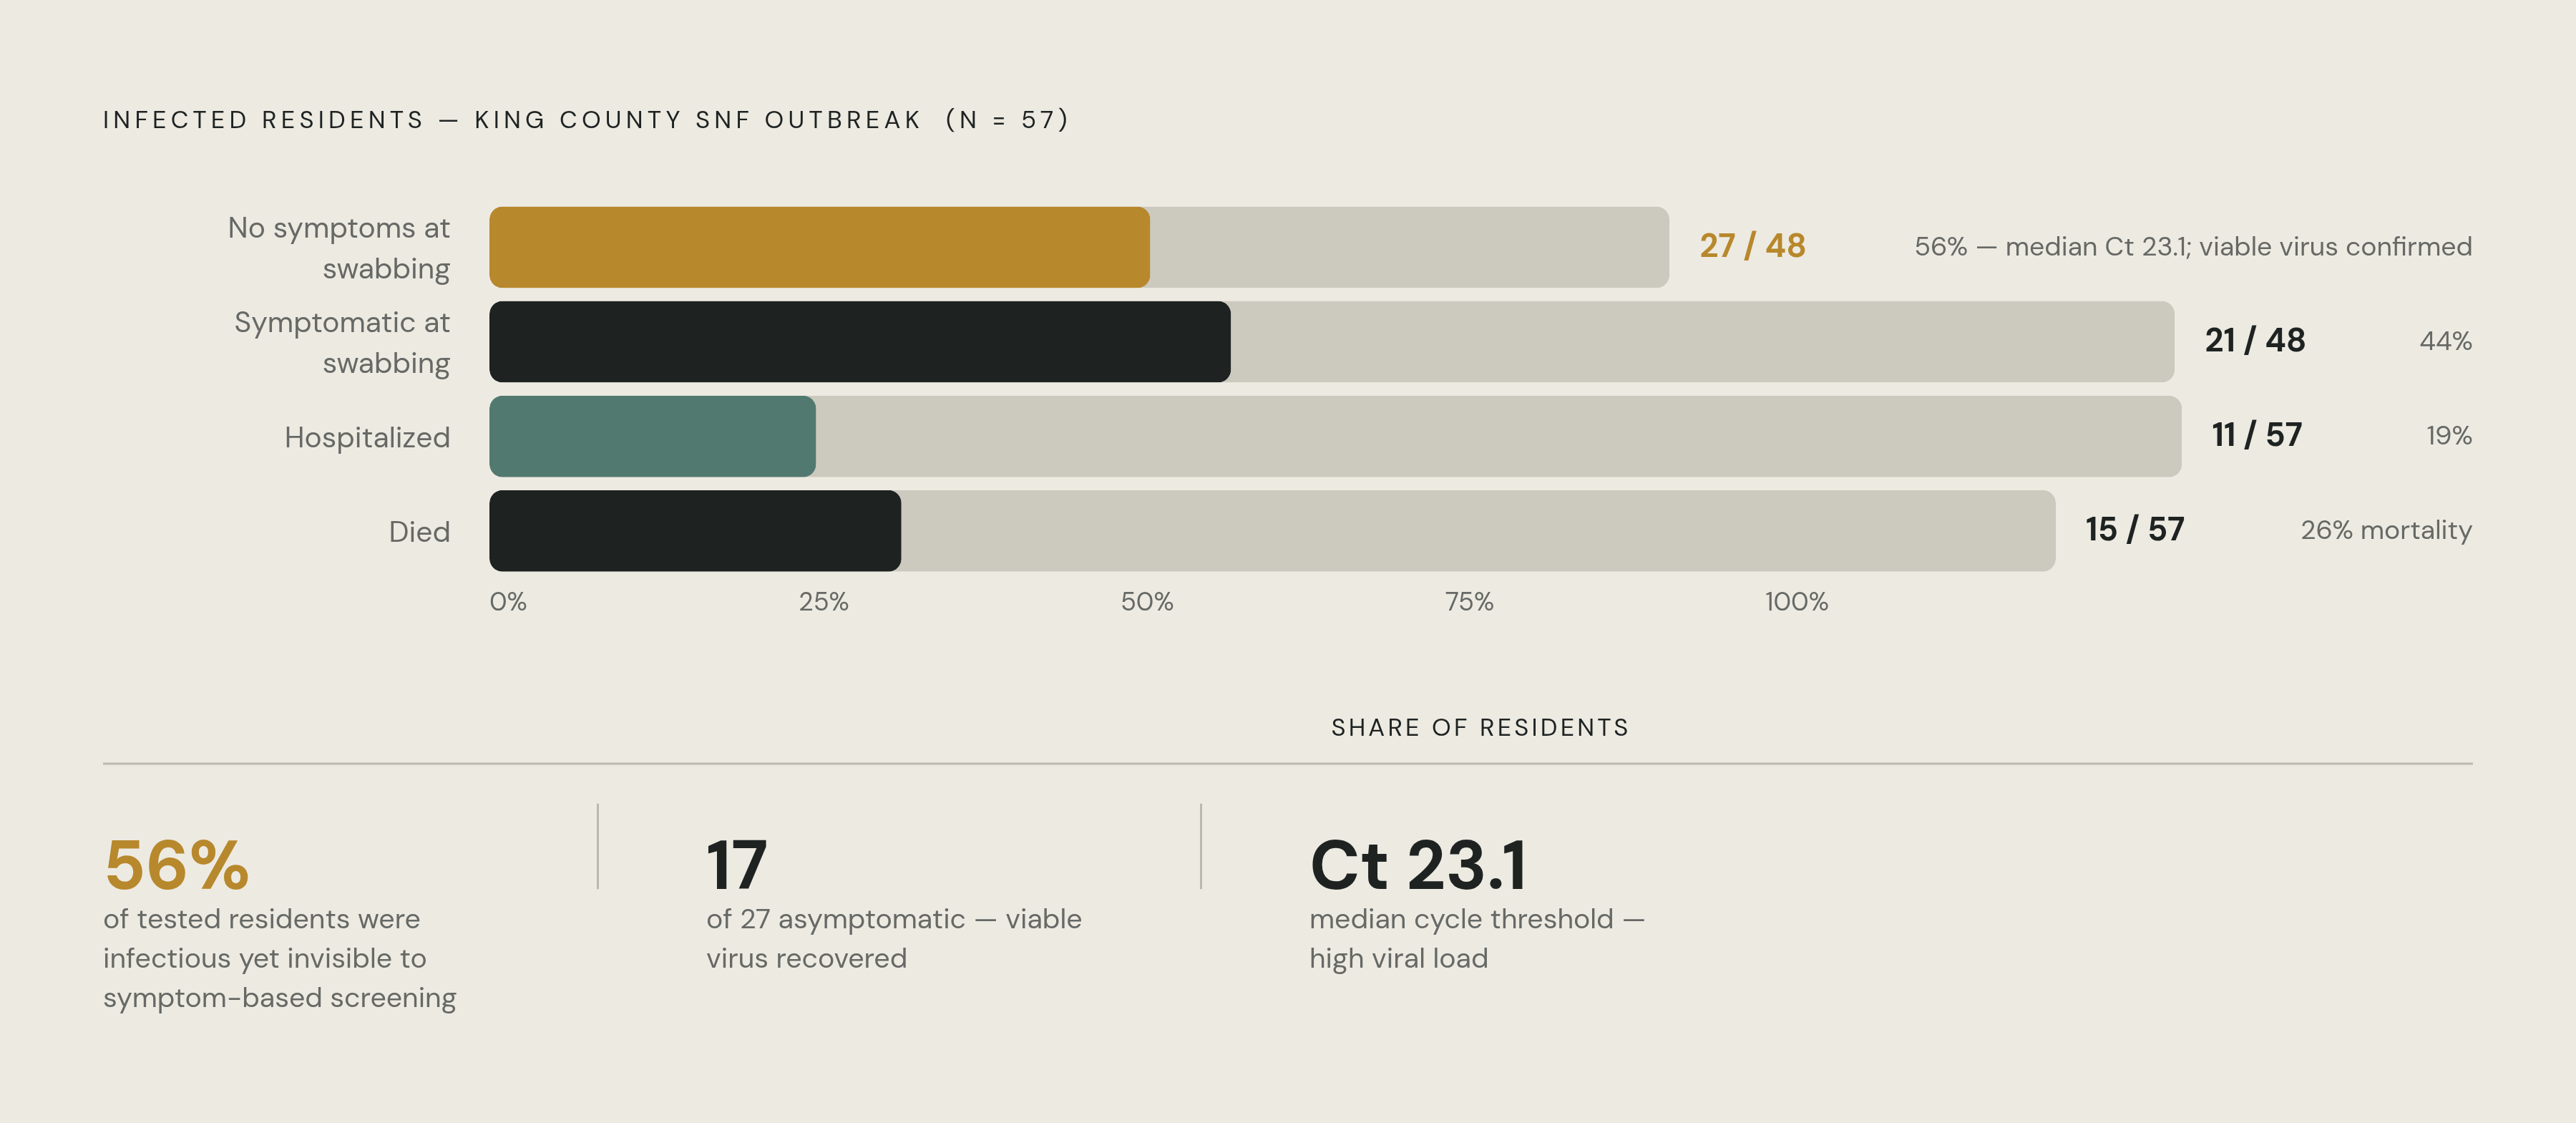
A NEJM study of a 116-bed, four-unit skilled nursing facility in King County, Washington, gave the field its clearest early evidence that symptom-only screening fails. Within 23 days of the first positive test, 57 of the facility's 89 residents, 64%, tested positive for SARS-CoV-2.
The detail that mattered most came from point-prevalence testing. Of the 48 residents who tested positive during those surveys, 27, or 56%, had no symptoms at the moment they were swabbed. Twenty-four of those residents subsequently developed symptoms, with a median onset of four days later. They weren't asymptomatic in any lasting sense. They were presymptomatic, actively infectious, and completely invisible to any screening protocol built around checking for fever or cough at the door.
The virology backed up the clinical concern. Presymptomatic residents carried a median cycle threshold value of 23.1, and researchers recovered viable virus from 17 presymptomatic residents, confirming active, transmissible infection. The virology backed up the clinical concern, and it wasn't a trace signal: it was live, transmissible virus circulating in residents who looked fine on paper. That's live, transmissible virus circulating in residents who looked fine on paper. Eleven of the 57 infected residents were hospitalized, and 15 died, a mortality rate of 26%. Genomic sequencing on 34 of the cases found that 27, 79%, sorted into two clusters differing by a single nucleotide, showing that the outbreak wasn't a series of unlucky coincidences. It moved unit to unit, along a traceable chain.
The study's authors stated their conclusion without hedging: infection-control strategies built solely around symptomatic residents were not enough to stop transmission once the virus got inside. If more than half the infectious population shows no obvious signs at the point of contact, a documentation system that only flags fevers and coughs will always undercount the outbreak. What's missing is earlier detection built into the documentation itself. It's a layer built to catch the subtle stuff, the appetite change, the new confusion, the resident who's just a little more tired than usual, tracked across days and across residents at once.
How unstructured nursing notes became the default symptom record and created a detection bottleneck
Walk into almost any SNF and the symptom record you'll find is free text. It's free text. Nurses log clinical observations daily into individual resident charts, in prose, and infection preventionists must piece together symptom patterns across those individual entries. The information exists. It's just sitting in thousands of separate entries that nobody is cross-referencing in real time.
The actual bottleneck is not a data absence problem, and it is precisely that: an architecture problem. It's an architecture problem. The symptom signal is already written down. It simply isn't aggregated across residents fast enough to matter.
It would be convenient if structured EHR diagnosis codes could fill that gap instead. They can't, reliably. A CDC-affiliated retrospective cohort study covering 31,136 nursing home residents across 76 facilities found that ICD-10 codes in electronic health records may not capture the full scope of infections present in the population. The CDC-affiliated study found that ICD-10 codes may not capture the full scope of infections present, suggesting that free-text nursing notes may carry signal that structured codes miss.
That creates a genuine operational problem. Reading through a unit's worth of unstructured notes by hand, looking for a shared symptom pattern across a dozen or more residents, takes time nobody has and money nobody's allocated for it. An infection preventionist cannot read every note from every shift simultaneously and reconstruct, after the fact, a pattern that was written down piecemeal over three days by six different nurses. The facility produces exactly the data it needs. It just can't act on it at the speed the 72-hour clock demands.
The infection burden that makes faster cluster detection a financial and clinical priority
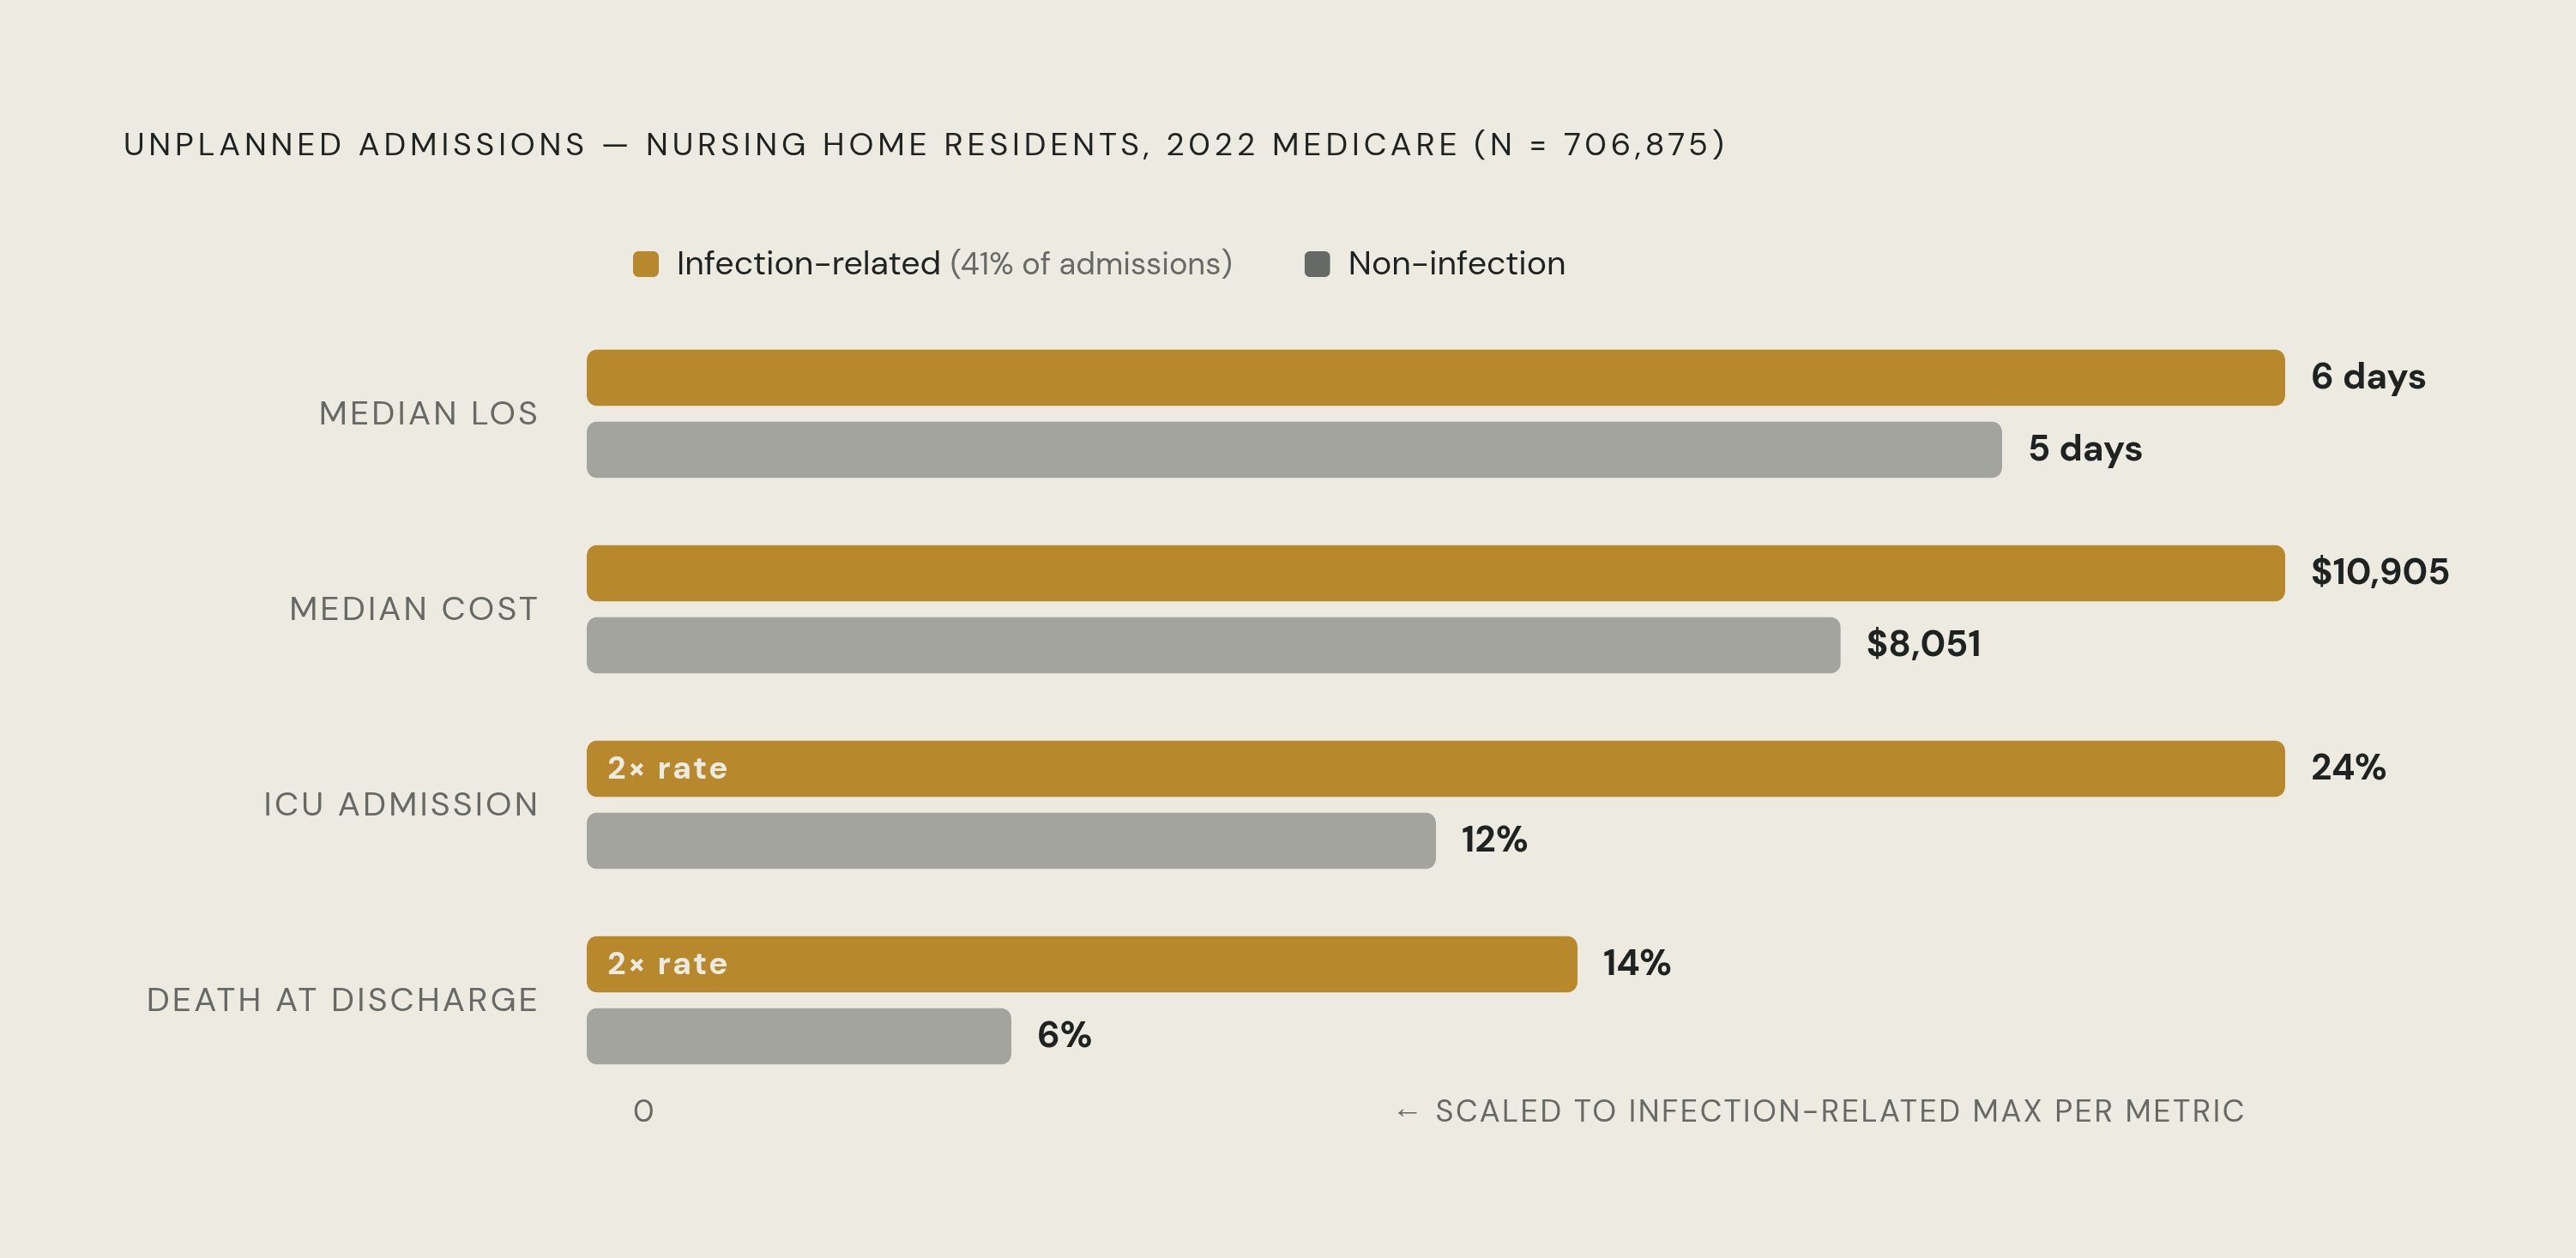
The cost of slow detection appears in the hospitalization numbers, and it's large. A CDC analysis of 2022 Medicare claims, published in Open Forum Infectious Diseases, found 706,875 unplanned hospital admissions among 494,611 nursing home residents that year. Of those, 286,446, or 41%, carried a primary diagnosis of infection.
Sepsis dominated that category, at 173,013 admissions, 60% of the infection-related total. Respiratory infections accounted for 53,288 admissions, 19%; device-related infections, 28,436, 10%; genitourinary infections, 23,089, 8%.
The infection-related admissions were also worse on every axis that matters. Median length of stay ran six days versus five for non-infection admissions. Median claim cost was $10,905 versus $8,051. ICU admission rates hit 24% versus 12%. Death at discharge occurred in 14% of infection-related cases versus 6% for everything else. Those are the downstream price tag of detection that happened too late. They're the downstream price tag of detection that happened too late, and every day a cluster sits unrecognized is another day residents drift closer to that hospitalization line. The argument for faster, documentation-driven detection isn't a theoretical nicety. It maps directly onto the single largest driver of preventable hospitalization in this population.
What a systematic approach to mining nursing notes for cluster signals looks like
Emerging surveillance work offers working proof of concept, and it doesn't require exotic technology. One approach aggregates unstructured nursing notes across a unit at once, rather than chart by chart. Text mining can scan those notes for symptom-related patterns, surfacing structured signal from unstructured writing before any lab result comes back. It's a low-tech version of the surveillance architecture the field needs, and it proves the concept doesn't hinge on proprietary AI to get started.
Natural language processing extends the same idea further. NLP tools can pull structured meaning out of free text through named entity recognition, clinical concept extraction, and temporal reasoning, that last one being directly relevant to sequencing when symptoms started across multiple residents. The same technique already solves a related problem in hospitals: most hospital EHRs have no dedicated field for documenting a patient's long-term-care exposure, so NLP reads the narrative notes to find it. Inside the SNF, that same logic applies to pulling symptom sequences out of the chart instead of waiting for a structured field that doesn't exist.
A study from Lawrence Livermore National Laboratory and Kaiser Permanente Northern California adds a geographic layer that deserves attention. Researchers trained machine learning models on 4.5 million patient records, combining ML-based diagnostic prediction with traditional epidemiological surveillance and a spatiotemporal aggregation step, on the premise that transmissible disease clusters geographically before anyone notices. Among diseases with five or more outbreaks between 2014 and 2022, the model caught 41 of 123 outbreaks, 33.3%, earlier than conventional surveillance, with lead times of one to 24 days, while generating an average of just 1.33 false positive outbreaks a year. Inside a nursing home, the natural "spatiotemporal unit" is the wing, the floor, the unit itself. The geography of the building is already the right frame for the analysis.
The progression from text scanning, to NLP feature extraction, to spatiotemporal ML aggregation is a layered stack, and each layer adds resolution to a signal the nursing notes already contain. It's a layered stack, and each layer adds resolution to a signal the nursing notes already contain. The same logic extends further: when longitudinal structured EHR data is combined with NLP-derived features, free-text clinical narrative can contribute meaningfully to predictive models. That points toward clinical narrative as more than a supplement to structured data for infection risk. In many cases, it's the richer half.
Documentation requirements under the 2025 multisociety nursing home IPC guideline
In October 2025, AGS, APIC, IDSA, PALTmed, and SHEA issued a joint consensus statement on infection prevention and control in nursing homes, replacing guidance that had stood since 2008. It runs to 42 recommendations, and several of them speak directly to the documentation gap described above.
Recommendation 1 calls for infection preventionists with genuinely dedicated time, plus staff time for IPC training and access to the infrastructure needed for surveillance and public health reporting. Recommendation 13 goes further, telling facilities to set surveillance priorities based on community risk, facility need, and regulatory demand, and to adopt standardized definitions and reporting methods. That's a direct mandate for the kind of aggregation architecture this piece has been describing.
Recommendation 25 covers outbreak detection and response in granular terms: track circulating community pathogens, understand transmission routes, run pathogen-specific screening, train staff on symptom reporting, enforce sick leave, test early, apply transmission-based precautions based on symptoms while diagnosis is pending, coordinate with hospitals and public health departments, vaccinate residents and staff, and plan access to therapeutics ahead of need. Symptom documentation sits at the center of that list as the trigger mechanism. Recommendation 10 adds that transfer paperwork must carry vaccination status, antimicrobial exposure, skin condition, device use, wounds, diarrhea, precaution type, pending results, and MDRO history, so the handoff itself is a documentation task, and a sloppy one creates real cluster risk. Recommendation 4 requires annual risk assessments across resident, process, and facility levels, and a documentation system that can't reveal cross-resident symptom patterns is, by definition, a process-level risk.
Set Recommendation 13's demand for standardized surveillance next to what most SNFs actually run, shift-by-shift free text with no aggregation layer sitting on top of it, and the gap is the whole problem this piece is naming.
The mandatory NHSN reporting requirements and their effect on symptom documentation
Starting January 1, 2025, long-term care facilities were required to report COVID-19, influenza, and RSV data to a national surveillance reporting system electronically, in a standardized format, on a set schedule. The influenza and RSV reporting obligations took effect on that same date, standardizing reporting obligations across all three pathogens.
The required fields aren't light. Facilities must report census, resident vaccination status for all three viruses, confirmed cases broken out by vaccination status, and hospitalizations tied to confirmed cases. Every one of those numbers has to be producible on demand, and roughly 15,000 nursing homes now report into this system.
What changed is the nature of the obligation itself. Voluntary, pandemic-era reporting has become permanent and mandatory, which turns symptom documentation into a compliance pipeline that has to stay continuously auditable, not a clinical habit that produces a chart someone reviews later. A facility still running on manual note review to assemble its NHSN numbers is fighting a cadence mismatch: the reporting schedule is continuous and standardized, and the underlying documentation is episodic and unstructured. Producing an accurate weekly flu or RSV count without a system that's already pulling symptom signal across residents, in something close to real time, isn't really possible. Whether facilities have fully registered it yet or not, the NHSN mandate has made real surveillance architecture a compliance requirement, not an optional upgrade.
CMS's 2026 survey changes for facilities with strong versus weak symptom documentation
CMS folded its focused infection control surveys into the standard survey process in 2025. Infection prevention expectations didn't loosen when that happened; they got woven into every standard survey and complaint investigation instead. IPC gets evaluated more often, not less.
Enhanced Barrier Precautions have become a central focus of that scrutiny. Surveyors assess whether infection prevention practices are consistently applied during resident care, and documentation of those practices sits directly in their line of sight. for residents with chronic wounds, indwelling devices, or MDRO colonization. Facilities have to know, with certainty, which residents require EBP, and that identification task depends entirely on current, accurate wound and MDRO documentation. It's another compliance requirement that depends on the facility's documentation system for its accuracy.
The bigger structural shift arrives with the Risk-Based Survey process, which CMS will roll out nationwide starting September 8, 2026. High performers get a shorter recertification survey, roughly half the time of the traditional Long-Term Care Survey Process, with fewer surveyors on-site. CMS expects about 12% of nursing homes to qualify at launch. The bar includes a five-star overall Care Compare rating, accurate data reporting, no citations for actual harm, immediate jeopardy, or substandard care in the last cycle, and no recent ownership changes. Accurate data reporting sitting on that list as a qualifying criterion is a direct reward for facilities whose documentation systems produce output that's reliable and auditable, and a direct penalty for those that don't.
The Center for Medicare Advocacy has pushed back on the model, warning that fewer surveyors, less time on-site, and fewer resident records reviewed could let real quality-of-care and quality-of-life problems slip through. That's a fair concern, and it points to a real asymmetry: the best-documented facilities get a lighter survey footprint, while facilities that don't qualify face standard surveys with infection control review now baked into every visit, surfacing documentation gaps that used to hide until a focused survey came around. The surveillance system a facility builds is doing two jobs at once now. It's the clinical engine for catching clusters early, and it's the audit trail that decides how the next survey goes. That dual function is exactly why facilities that modernized their documentation architecture early are standing on firmer ground than those still waiting.
Building a documentation system that can detect clusters before the 72-hour threshold runs out
None of this points to a single software purchase solving the problem. It points to a layered discipline: nursing notes captured consistently, a mechanism for viewing those notes across an entire unit at once rather than resident by resident, text-mining or NLP tools tuned to catch respiratory-associated language and subtle symptom drift, and a spatiotemporal lens that treats the wing or floor as the natural unit of epidemiological analysis, the same way the Lawrence Livermore and Kaiser Permanente research did.
The 72-hour outbreak threshold isn't a suggestion; it's a countdown that starts the moment the first symptom appears, whether or not anyone's aggregated the data yet to notice. The King County outbreak showed what happens when detection depends on visible symptoms alone: more than half the infectious residents at the point of testing had none. The multisociety guideline, the NHSN mandate, and the 2026 survey overhaul have each, in their own register, said the same thing back to the industry, that documentation has to function as a real-time surveillance system now, not an archive someone reads after the fact. Facilities that treat their nursing notes as the first line of outbreak defense, and build the aggregation layer to match, will catch clusters inside the window that matters. The ones that don't will keep discovering their outbreaks the same way King County did: after the fact, from a chart that told the whole story, just too late to read it.
Sources
- Influenza, COVID-19, and Respiratory Illness Outbreak Quicksheet
- Presymptomatic SARS-CoV-2 Infections and Transmission in a Skilled Nursing Facility | New England Journal of Medicine
- P-1921. Nursing Home Resident Hospitalizations Related to Infection, Medicare Claims, 2022
- Evaluation of COVID-19 Diagnosis Codes for Identification of SARS-CoV-2 Infections in a Nursing Home Cohort, 2022–2023
- Epidemiology of Covid-19 in a Long-Term Care Facility in King County, Washington | New England Journal of Medicine
- cambridge.org
- spice.unc.edu
- cms.gov