Fall Pattern Recognition Across Shift and Location Data
Nursing homes can spot fall patterns hiding in their own data by tracking location, shift, and time.
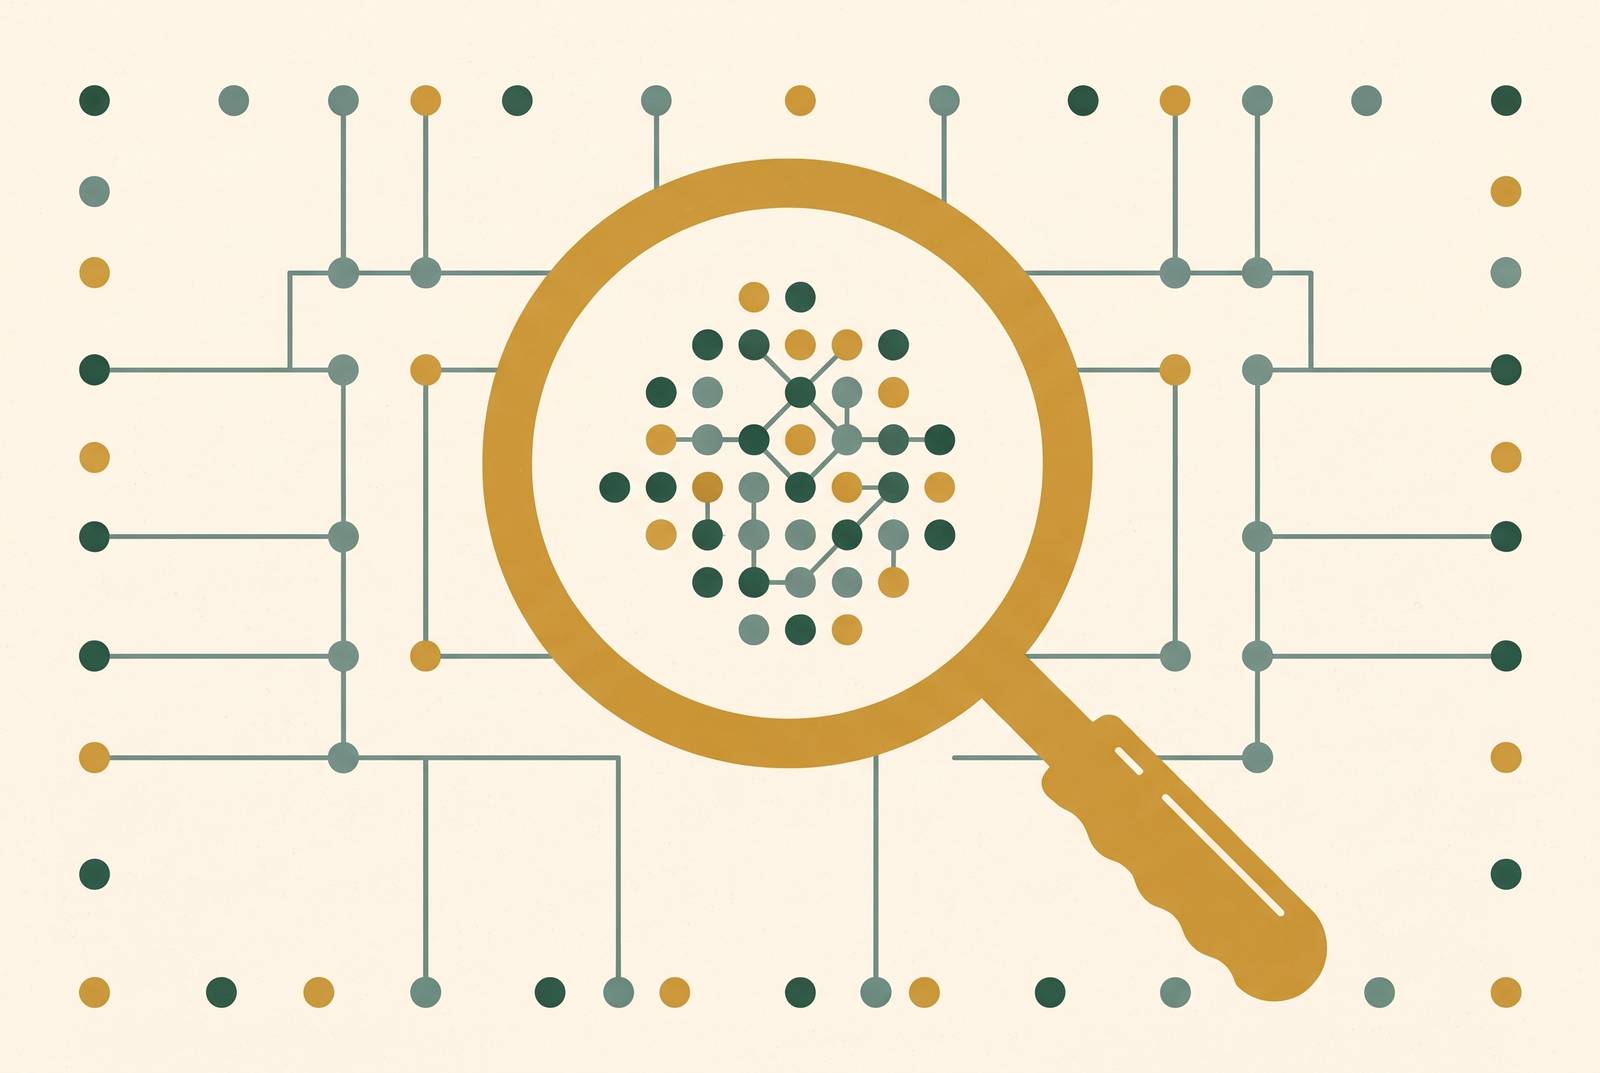
Fall incidents in skilled nursing facilities aren't random accidents scattered across a building. They cluster by shift, by room, by time of night, in ways that become visible the moment someone actually aggregates the data facilities already collect. The gap between a facility that reacts to each fall as its own isolated event and one that prevents the next fall is, in large part, a gap in reading documentation that already exists.
The scale of the problem makes this more than an academic exercise. A JAMDA observational study put the annual fall rate among nursing facility residents somewhere between 50% and 75%, two to three times the rate seen in older adults still living in the community. That's not a rounding error. That's most residents in most buildings falling at least once a year, and a documentation trail, somewhere, for every single one.
What the regulatory environment now demands from fall documentation
Starting January 2026, CMS changed how it selects facilities for the Special Focus Facility program, and fall prevalence now plays a direct role in selection, with Skilled Nursing News reporting a real shift in what regulators are watching. Skilled Nursing News has reported a real shift in what regulators are watching. Facilities that end up in the SFF program and then draw Immediate Jeopardy citations on two separate surveys face discretionary termination from Medicare and Medicaid, and those citations count cumulatively across a standard survey and a complaint investigation. There's no reset button between the two.
A September 2025 OIG report found that nursing homes fail to report 43% of major falls, and that underreporting is the documentation gap most administrators don't want to admit is bigger than they think. An OIG report found that nursing homes fail to report 43% of major falls. Not underreport slightly. Miss almost half.
CMS has also redefined what counts as a major fall and widened MDS reporting to capture intercepted falls and falls caused by external forces, ACPlus reports. Practically, this means the reported fall numbers at a lot of facilities will climb even if nothing on the ground actually got worse. That distinction matters for anyone trying to read their own quality metrics honestly.
Then there's the Risk-Based Survey process, rolling out nationwide on September 8, 2026. CMS estimates roughly 12% of nursing homes currently qualify for this lighter-touch survey track, and actual-harm or Immediate Jeopardy citations are a direct disqualifier, Hall Render reports. Fall-related deficiencies knock a facility straight out of contention. Layer on the corrective-action requirement effective March 30, 2026 and revised that April, and the standard for a corrective-action filing has moved past a generic template. Surveyors are now looking for evidence that a facility identified a pattern and intervened.
Where falls happen: the location signal hiding in every incident report
The bedroom is where falls happen. Every study lands on some version of this. A study published through SAGE Journals that tracked location across 481 falls in long-term care found 57.4% happened in the resident's own bedroom. A 2026 observational study out of a 120-bed skilled nursing facility in Roanoke, Virginia, running from November 2023 through April 2025 and covering 212 fall events, put the bedroom share at 83.0%. A large UK care-home case-control study found 98.5% of falls happened indoors, concentrated in the bedroom, the lounge, and the bathroom.
Behind the bedroom, the toilet or shower area accounted for 11.4% of falls in the SAGE study, with lounge and activity spaces at 9.6% and dining rooms at 4.4%. One inpatient case series broke it down differently again: 42.1% of falls happened right at the bedside, 34.2% near the toilet, and the remaining 23.7% scattered across other spots.
Lighting compounds all of it. Research summarized in PMC found lighting fell short of recommended levels for focused activity in 57.7% of bedrooms and 68.5% of bathrooms across the long-term care facilities studied. Raising light levels by 100 lux in key areas was tied to a 9% to 10% drop in fall rate. That's a fixable problem, and it's exactly the kind of fix that only becomes obvious once someone pulls location data out of thirty separate incident notes and lines it up side by side.
That's the real point here. One note at a time, a location field is a compliance checkbox. Thirty notes stacked together become a heat map, and the heat map is what tells a nursing director that a particular resident's room or the second-floor bathroom near the nurses' station keeps recurring. Location and timing pull together into the same picture, the subject of the next section.
When falls happen: reading shift timing as a structural risk signal
Night shift carries a disproportionate share of falls almost everywhere researchers have looked. In one inpatient case series, 58 of 76 falls happened on the night shift, against just 18 during the day. Research across inpatient settings consistently finds falls happen more often at night, and patients who fall overnight tend to be older than those who fall during the day.
The shift change itself is a structurally weak moment, and it repeats on a predictable schedule. A study using Payroll-Based Journal data across 13,071 skilled nursing facilities found 83% run on a dominant eight-hour shift pattern. The same handoff moments recur at the same clock times, day after day, week after week. During that handoff, the outgoing nurse holds context the incoming nurse hasn't absorbed yet, and a resident who notices the change in staff on the floor may try to get up or move on their own before anyone new has settled in.
Research has found that more nursing time per patient at night tracks with fewer falls, but more nursing time during the day can track with more falls. Read that carefully: daytime falls likely cluster during the highest-acuity stretches, when staffing is heaviest precisely because the workload demands it.
Rounding schedules add another layer. Most senior living communities check on residents roughly every two hours during the day and every two to four hours overnight, IntelliSee reports. The stretch between rounds is where unwitnessed falls pile up, and a facility that reviews its own time-stamped incident notes will start to see where those stretches run longest: the stretch before a shift change, the period after a new night crew comes on, or the early-morning toileting window that loops right back to the bathroom-location concentration covered above.
How workforce instability writes itself into shift-level fall patterns
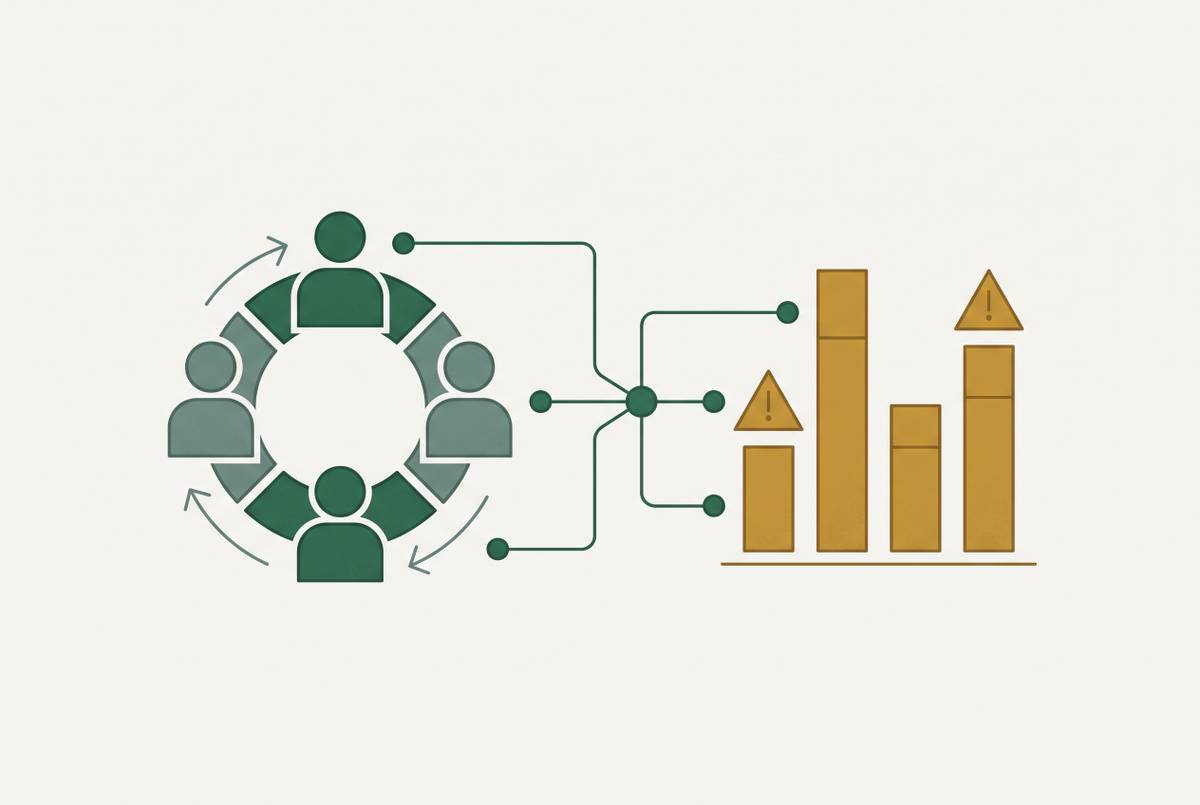
Falls track workforce stability, not staffing volume. That's the finding from Covr's analysis of Payroll-Based Journal data across more than 13,000 skilled nursing facilities, reported by McKnight's: facilities with the highest staff turnover averaged 3.44% falls with major injury, against 2.96% at the lowest-turnover facilities. The gap isn't enormous, but it's consistent, and it points somewhere specific.
Agency staffing crosses a threshold at 8%. Facilities filling that share or more of shifts with agency workers saw higher fall rates, especially where agency CNAs and LPNs filled the gap. An agency worker who has never met a resident before that shift simply does not carry the resident-specific knowledge a familiar staff member would. That kind of memory does not travel with a temp assignment.
Simply adding hours doesn't fix this. The Covr analysis found little measurable relationship between total RN hours or overall hours per resident day and fall outcomes. And the pressure to solve staffing through hours alone has lost its main lever anyway: Facilities continue to face compliance and quality expectations around staffing even as the regulatory environment around minimum staffing requirements has remained unsettled.
For pattern recognition, this changes how a note should be read. An incident logged on a shift with heavy agency fill is a different data point than one from a fully staffed, low-turnover shift, even if the location and time of day match exactly. Cross-referencing fall timing against Payroll-Based Journal staffing data lets a facility tell those two situations apart, and that distinction changes what the intervention should be.
What clinical notes already contain and why aggregation is the missing step
Go back to that 81.1% unwitnessed figure from the Roanoke study. If no one saw the fall, the incident note is the entire record. It's not a supplement to memory; it's all there is.
A properly written incident note usually already contains the time it was discovered, the location, what the resident was doing (transferring out of bed, walking to the bathroom, reaching for something), whether staff were present, an environmental detail such as a wet floor, a dim hallway, or a bed rail left down, and something about the resident's cognitive and physical state. That's six separate signals sitting in one paragraph of narrative text.
This information sits locked inside unstructured prose, scattered across dozens of separate notes, and is almost always reviewed one at a time rather than side by side. It's that it's locked inside unstructured prose, scattered across dozens of separate notes, and almost always reviewed one at a time rather than side by side. Reading a single note tells a charge nurse what happened to one resident on one night. Reading thirty of them together tells a director of nursing what's happening in that same room, or on the 11-to-7 shift, or whenever the agency nurse is covering the second floor.
The OIG's 43% underreporting figure illustrates how documentation can fail to reach the formal compliance reporting layer. An event gets written up carefully in a nursing note and then never makes it up to the formal compliance reporting layer, because nothing connects the two systems automatically. Electronic health record platforms already hold a substantial share of these notes. What's missing at most facilities is the extraction and pattern-surfacing step, not the data itself. It's the extraction and pattern-surfacing step that turns dozens of narratives into a shift-level or location-level chart a nursing manager can actually act on, without asking staff to document one word more than they already do.
Moving from pattern identification to structured prevention: what the evidence supports
Single-fix approaches to fall prevention don't hold up. The evidence, summarized by ACPlus in March 2026 and drawing on guidance from AOTA, APTA, and the National Council on Aging, points to multifactorial, interdisciplinary programs as the standard that actually moves the needle, with documented fall-rate reductions running from 15% up to 57% in post-acute settings.
Pattern data tells a facility where to point that kind of program first. If bedroom and bathroom lighting sits below the recommended threshold in most rooms, that's a concrete fix, backed by the 9% to 10% fall-rate reduction tied to a 100 lux increase, and it's a fix a facility can budget for and finish. If the incident notes cluster around shift-change windows, the fix is tightening the handoff protocol itself, not necessarily adding more hours to the schedule. If agency fill rate lines up with the fall-rate spikes, the fix is reducing reliance on agency staff in the specific units and shifts where that spike occurs, rather than treating agency use as a uniform, building-wide problem.
Technology has a role here too, but a narrow one. In May 2026, AHCA's Safe Steps Forward toolkit pushed nursing homes toward proactive, technology-enabled intervention rather than after-the-fact documentation. Monitoring tools that track gait changes over time or shifts in nighttime restlessness and bathroom frequency generate a leading indicator, one that appears before the fall rather than after it. Ambient sensor systems that read room-level data without adding a new task to a CNA's shift fit the same principle running through all of this: the fix has to sit on top of what staff are already doing, not add another form to fill out.
QAPI teams need to hold two facts apart at once. Quality measure shifts might reflect the expanded MDS definitions now capturing intercepted falls, not an actual decline in care, CMS guidance makes clear. Pattern analysis that separates a real structural risk (a dim bathroom, a chronic handoff gap) from a definitional reporting artifact is what lets a QAPI team spend its effort on the problem that's actually there.
Building a continuous pattern-monitoring process rather than a survey-season audit
That 43% underreporting figure from the OIG report says something else too: a lot of facilities only take a hard look at their own fall documentation when a survey or an investigation forces the issue. By then, the pattern that produced three falls in the same room over two months has already run its course, and the fourth fall has probably already happened.
Continuous monitoring means treating incident notes as a running dataset rather than a filing requirement. That means checking location concentrations monthly, not annually. It means lining up fall timestamps against shift schedules and Payroll-Based Journal staffing data on an ongoing basis, so a spike tied to an agency-heavy week gets caught while it's still a week, not after it's a quarter. It means treating a corrective-action filing not as a document written for a surveyor after the fact, but as a record of a pattern a facility already caught and already acted on.
None of this requires new documentation. The notes are already being written. What separates a facility that reacts from one that prevents is whether anyone is reading those notes in aggregate, on a schedule, before the survey team walks in and does it for them.