Hydration Incident Documentation and Early Dehydration Flags
Early warning signs matter only if charting captures them in ways staff can actually track.

Dehydration in long-term care is common enough that it should stop being treated as a surprise finding. Up to 38% of LTC residents may be dehydrated on any given day, and a 2026 University of Cincinnati VA nursing home quality-improvement study put prevalence as high as 75% in the population it examined. A missed warning sign written down in a form nobody downstream can actually use turns that baseline into a fall, an infection, or a hospital admission. It's a warning sign written down in a form nobody downstream can actually use.
Older adults are physiologically set up for this outcome. Thirst perception declines with age, renal concentrating ability drops off, and total body water shrinks as a share of body mass: three separate mechanisms pushing the same direction. The old advice to "drink when you're thirsty" assumes a signal that, in a lot of residents, simply isn't firing anymore. Cognitive impairment compounds the problem in a specific and dangerous way: the residents least able to report their own thirst are frequently the same residents whose charts describe fluid intake as normal, when it was anything but. Left uncaught, this cascades into falls, UTIs, acute kidney injury, delirium, hospitalization, and in the worst cases, death, and the chain usually starts with a signal someone did see and nobody flagged.
What the clinical signs of early dehydration look like, and how reliably staff can detect them
Thirst, dry mouth, and dark urine are the signs nurses run into first, and they earn their place because charting them requires no lab order and no delay. A nursing aide doing rounds can catch all three without special equipment. Treating them as sufficient on their own, though, is where facilities go wrong.
A 2025 systematic review and meta-analysis by Ogbolu and colleagues, published in Healthcare, pooled the data on these clinical signs and found sensitivity of 85% and specificity of 70%, with a positive predictive value of 75% and a negative predictive value of 80%. In plain terms, roughly one in five dehydrated residents will look clinically unremarkable on observation alone. A resident who shows none of the classic signs is not automatically fine, and any facility that treats a clean visual check as clearance is making a bet the numbers don't support.
Lab markers close some of that gap, but not by crowning a single winner, and facilities that go hunting for one definitive number are wasting their time. Research evaluating multiple lab indicators, including BUN/creatinine ratio at or above 20:1, serum sodium, serum urea and creatinine, and estimated GFR, has consistently found that no single marker is sufficient on its own. The BUN/creatinine ratio is the most operationally convenient of the group for LTC settings, since it's often sitting in labs already ordered for residents on diuretics or with a renal history, no extra draw required. Chronic renal failure distorts that ratio, though, so it has to be read in context, never as a standalone verdict.
What complete hydration documentation must capture (the charting elements that create a usable record)
"Drank well at lunch" is the phrase to root out, along with its many cousins. It's probably the single most common form of documentation in this space, and it creates both a clinical blind spot and a compliance exposure at the same time, because nobody can trend it, audit it, or compare it day over day.
Complete documentation starts with fluid intake volume in actual milliliters, recorded at each meal and snack rather than reconstructed at shift's end. It also has to capture beverage preferences and refusals: not just whether a drink was offered, but whether it was accepted, partially accepted, or turned down, and why. A refusal on one shift is an anecdote. A refusal pattern persisting across consecutive days is an early warning that should trigger a reassessment, not another well-meaning offer of water an hour later.
Assistance level matters just as much as volume, and it's the piece facilities skip most often. Surveyors look specifically for documentation of the staff effort involved in meeting a resident's hydration needs. A chart showing substantial fluid intake but saying nothing about how much prompting, positioning, or hand-over-hand assistance it took to get there is missing half the clinical picture, and a compliance requirement besides.
Output rounds out the record: urine color, noted consistently alongside frequency and any reported discomfort. One dark-urine entry is noise, easily explained by a hot afternoon or a skipped glass of water. Three in a row is a trend, and documentation that can't surface a trend isn't doing the job it exists to do.
How specific charting patterns function as early warning flags, and how they get buried instead
The signals are already being written down. Intake refusals, dark urine, new confusion, a two-pound weight dip, all of it lands in the record constantly. What doesn't happen is aggregation. The entries scatter across different sections of the EHR, phrased differently by whichever nurse or aide happened to be on shift, and nobody's job is to reassemble them into a single picture.
Research into frontline care staff has found that the barriers to effective hydration monitoring tend to be structural rather than attitudinal, imprecise record systems and the absence of specific protocols for acting on what staff observe. That's a structural failure, not a training failure, and the fix for one looks nothing like the fix for the other. Facilities that respond with another in-service instead of rebuilding the chart are treating the wrong problem.
The problem compounds when intake gets logged as a narrative estimate instead of a measured number. Reconstructing a trend from four days of freetext notes means holding all of it in your head at once, cross-referencing entries written in different words by different people. That kind of manual synthesis doesn't happen at the pace of routine care, and the format simply doesn't support the task being asked of it.
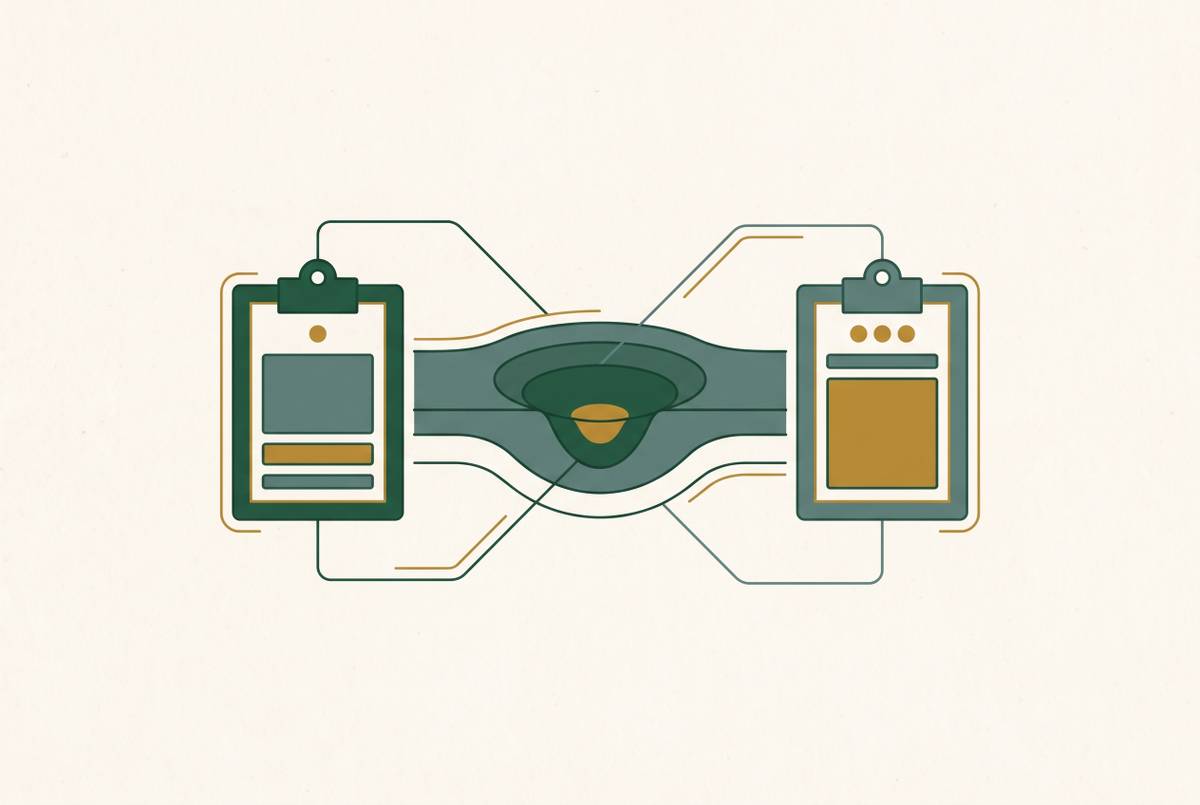
Take the shift-change version of this. A resident drinks a little less than usual on day shift. Evening shift notes the same thing, unaware of the morning's entry. Night shift writes "sleeping more than usual," which reads, in isolation, like nothing. Three honestly recorded nursing observations, each one looking like normal daily variation on its own, together describe a dehydration trajectory building in real time. Aggregation is the missing step in most current workflows, and it's the step that turns three shrugs into one alert.
What facilities can do to structure documentation practices that surface dehydration risk earlier
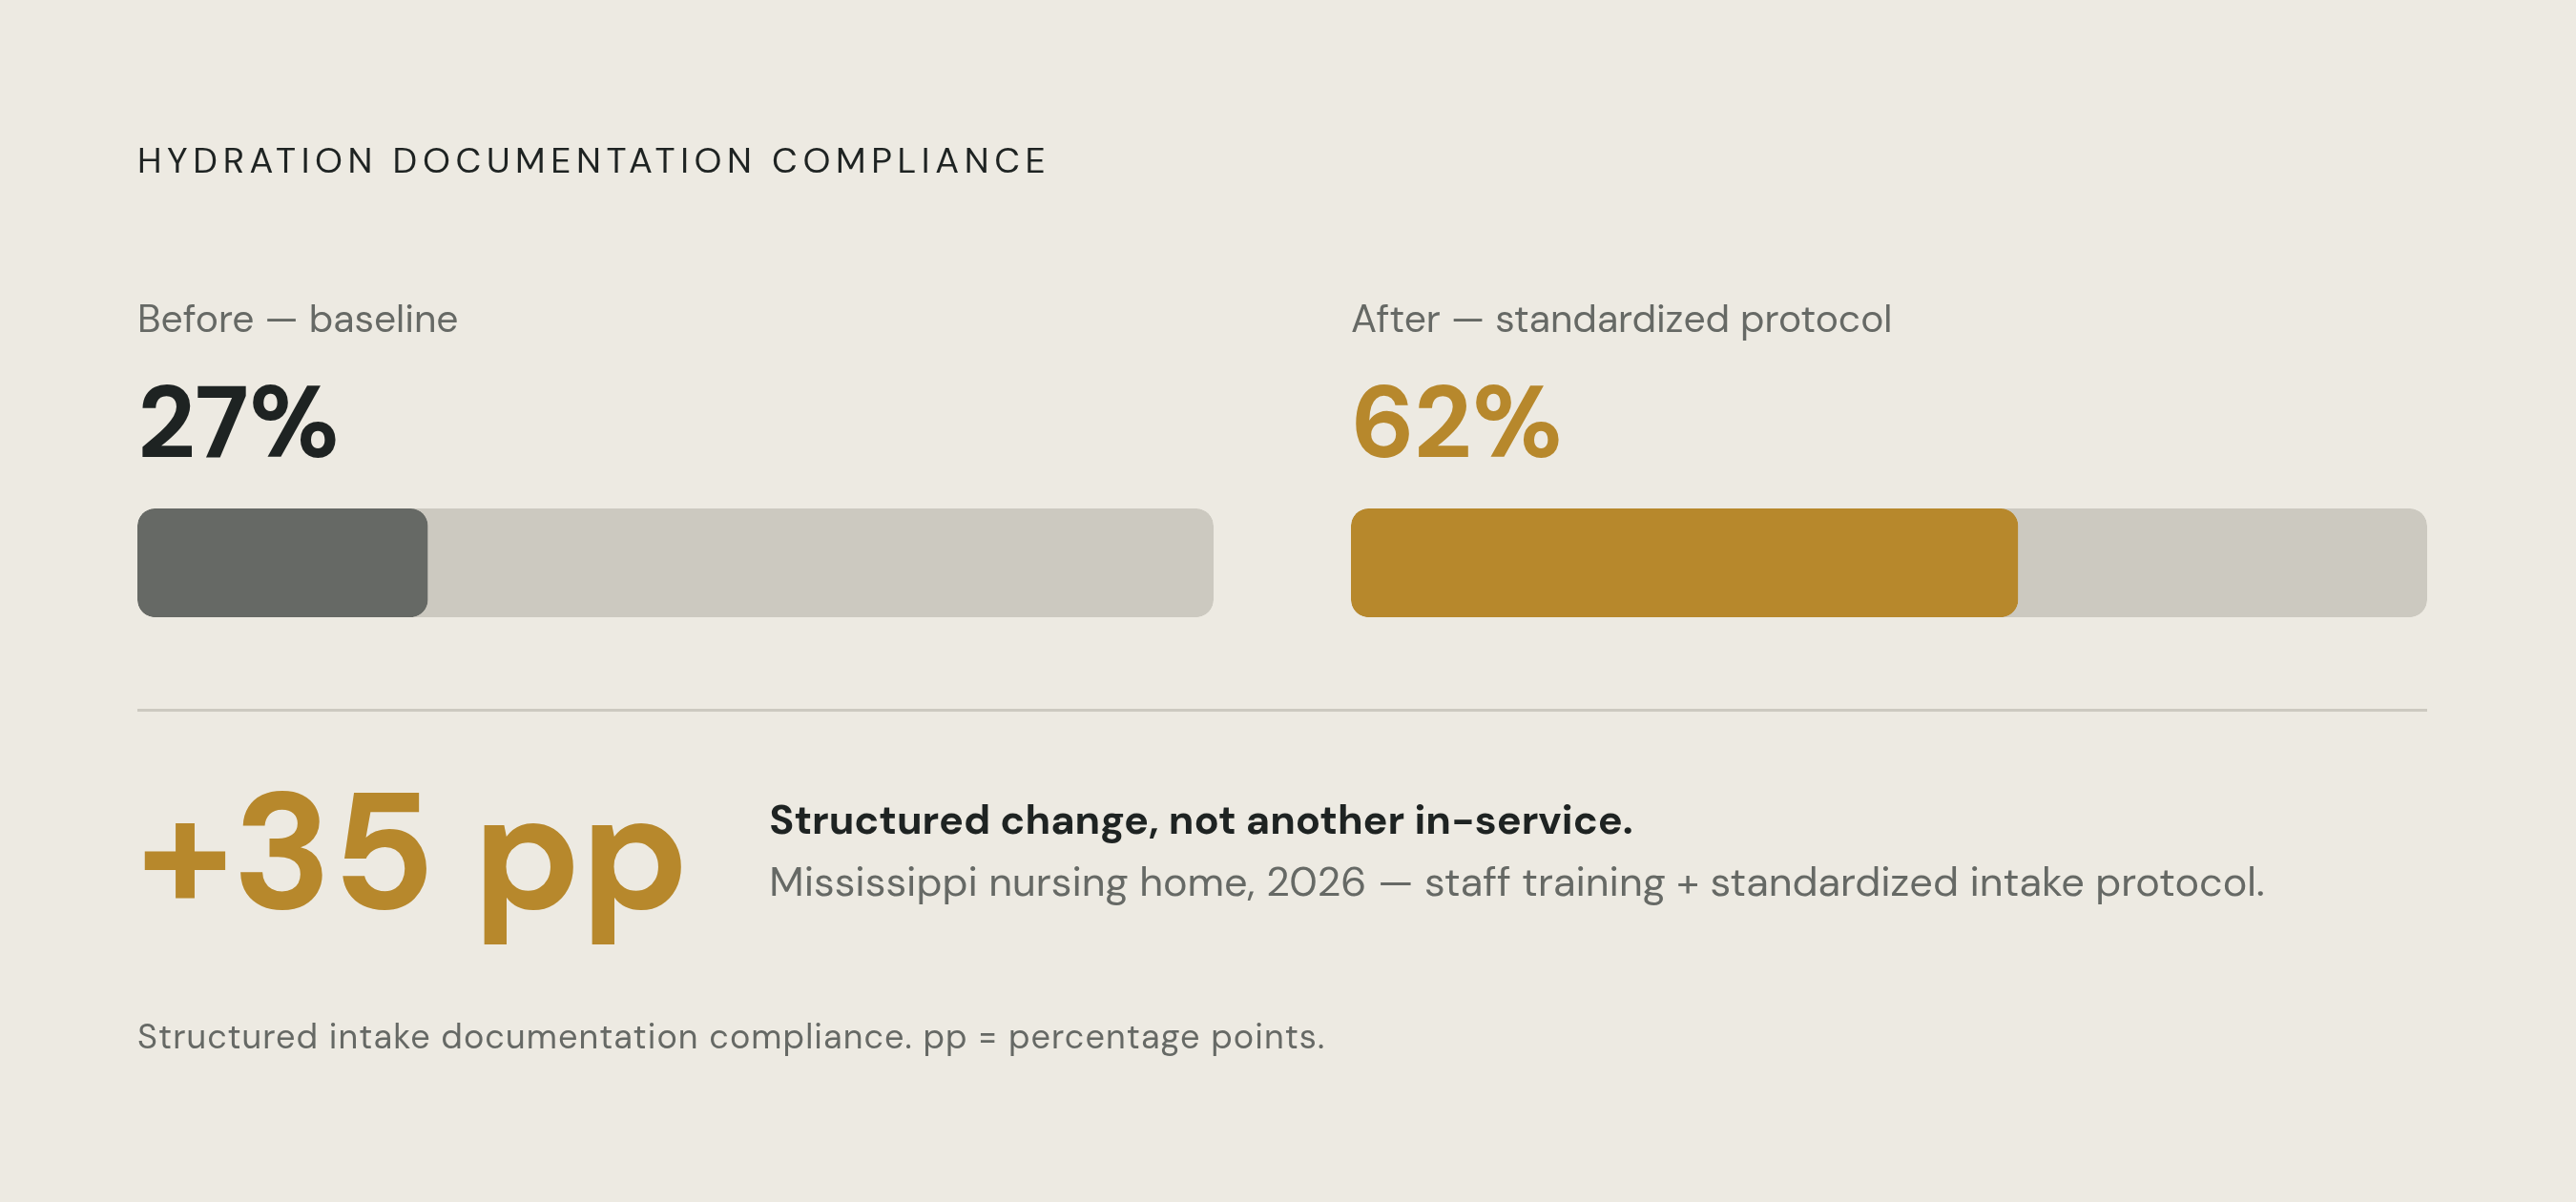
Standardize the intake format across all three shifts first. Everything else is secondary to this, and the evidence backs the order of operations. A 2026 Mississippi nursing home implementation study found baseline compliance with structured intake documentation at just 27%. After the facility rolled out a standardized hydration protocol along with staff training, post-intervention compliance reached 62%, a 35-percentage-point jump. A record nobody can trend fails as an early-warning tool, and a record built to be trended doesn't.
Beyond format, facilities need a trigger protocol built into the workflow itself: a defined intake threshold, say a percentage of the resident's care-planned daily fluid target, below which the charge nurse gets notified automatically instead of waiting for the next scheduled assessment. Deviation reporting has to happen in real time, not on whatever cycle the care plan happens to specify.
Hydration data also needs to talk to the rest of the care plan. A documented behavioral change or an unexplained weight loss should trigger a structured hydration review as a matter of course, not sit in its own narrative note waiting for someone to notice the coincidence. Urine color charting deserves more credit than it usually gets, too: a standardized color scale takes seconds to use, asks for no clinical judgment from the aide filling it in, and produces a data point that can actually be trended, which "urine looked a bit dark" never will.
How unstructured EHR notes already contain the risk signals, and what it takes to make them readable
The data facilities need is already sitting in the system. Every refusal, every behavioral note, every weight entry and urine observation that staff document exists somewhere in the EHR. The shortfall is extraction and interpretation. It's extraction and interpretation.
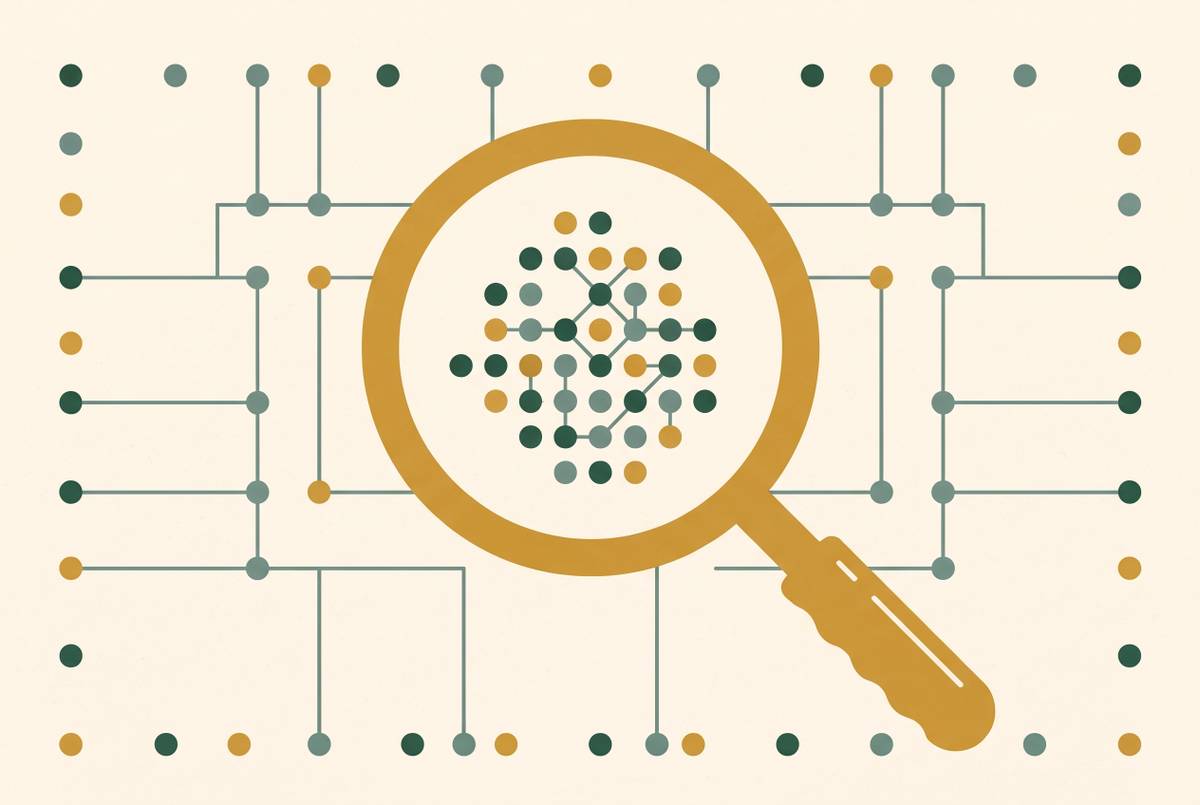
Narrative notes are, ironically, often the richest source of clinical nuance available, capturing detail that structured fields never will: how a resident refused a drink, what their affect looked like in the moment, what alternative got tried, how it turned out. None of it is searchable at scale without either natural language processing or a human reading through it line by line, and the second option doesn't scale across a building with a hundred residents and three shifts a day.
Adoption of tools that could close that gap remains thin in this sector, and that lag is the real story here, not a footnote to it. AI use in nursing facilities rose from 3.1% in 2023 to 4.5% in 2025, a real increase but still well below the broader healthcare average of 8.3%. The sector faces structural headwinds that have slowed technology adoption more broadly. Skilled nursing lags behind the setting it should be learning from, and the gap has a clinical cost attached: catching a dehydration trend earlier can mean a care plan adjustment instead of an ambulance.
The compliance cost of documentation gaps (what surveyors look for and what non-compliance costs)
F692, under 42 CFR §483.25(g)(1)-(3), is the citation surveyors reach for on hydration deficiencies, and it appears regularly in actual SNF deficiency records. Surveyors work through CMS Form CMS-20092 as their investigative pathway, checking the care plan, monitoring practices, staff assistance documentation, and intervention records in that order.
The CMS Hydration Pathway spells out what surveyors are hunting for: a care plan naming specific risk factors, a documented daily fluid intake target, staff assistance and encouragement recorded as it happens, and interventions that account for what the resident actually prefers to drink. A facility can have clinically thorough documentation and still fail the audit if none of it ties back to the care plan. Completeness and compliance are not the same test, and passing one doesn't guarantee passing the other.
The financial exposure is not abstract. Under the January 2026 CMS civil monetary penalty inflation adjustment, Category 2 per-day penalties run from $136 to $8,211, and per-instance penalties run from $2,739 to $27,378. CMS can apply both per-day and per-instance penalties from the same survey, and stack them across multiple citations, so an immediate jeopardy finding that takes time to resolve can accumulate penalties across both per-day and per-instance categories before anyone has even discussed a corrective action plan.
There's a second-order cost, too. Sustained noncompliance past a survey can trigger further CMS enforcement actions affecting admissions and payment. In a sector where referral-to-admission conversion has historically peaked around 37% and dropped as low as 23.6%, a payment denial doesn't just cost revenue on paper. It lands on a census that was already fragile to begin with, and it compounds a problem that started with a chart entry nobody flagged.