Linking Incident Data to Staffing Patterns in LTC Facilities
Matching shifts to incidents reveals where staffing cuts hit residents hardest.

What the research shows when incident data is matched to staffing patterns
The national average for nurse staffing sat at 3.75 total hours per resident day (HPRD) as of the first quarter of 2026. That number tells a facility almost nothing about where its residents are actually at risk, and treating it as a meaningful benchmark is a mistake facilities should abandon. Matching incident data against staffing patterns, shift by shift and staff category by staff category, reveals a sharper picture, one that turns a compliance exercise into something closer to a forecasting tool.
Start with falls, because the gap here is the clearest one in the data. Research drawing on Payroll Based Journal data found that homes in the bottom quartile of RN hours had 30 to 40 percent more falls with major injury than homes in the top quartile. That range separates a fall that ends with an ice pack from one that ends with a hip fracture and a hospital transfer.
Pressure injuries follow a similar shape, though the staffing category responsible shifts a little. A study of 998 residents across nine nursing homes found that 61 cases, 6.1 percent of the sample, developed new pressure injuries, and fewer LPN staffing hours was one of four significant predictors. Homes with fewer licensed nurse hours carried meaningfully higher pressure injury risk than those with stronger RN coverage. The relationship tracks to licensed nurse hours specifically, not total headcount: a facility can pad its HPRD with CNA hours while running thin on LPNs and RNs, look fine on paper, and still carry real skin-integrity risk on the floor.
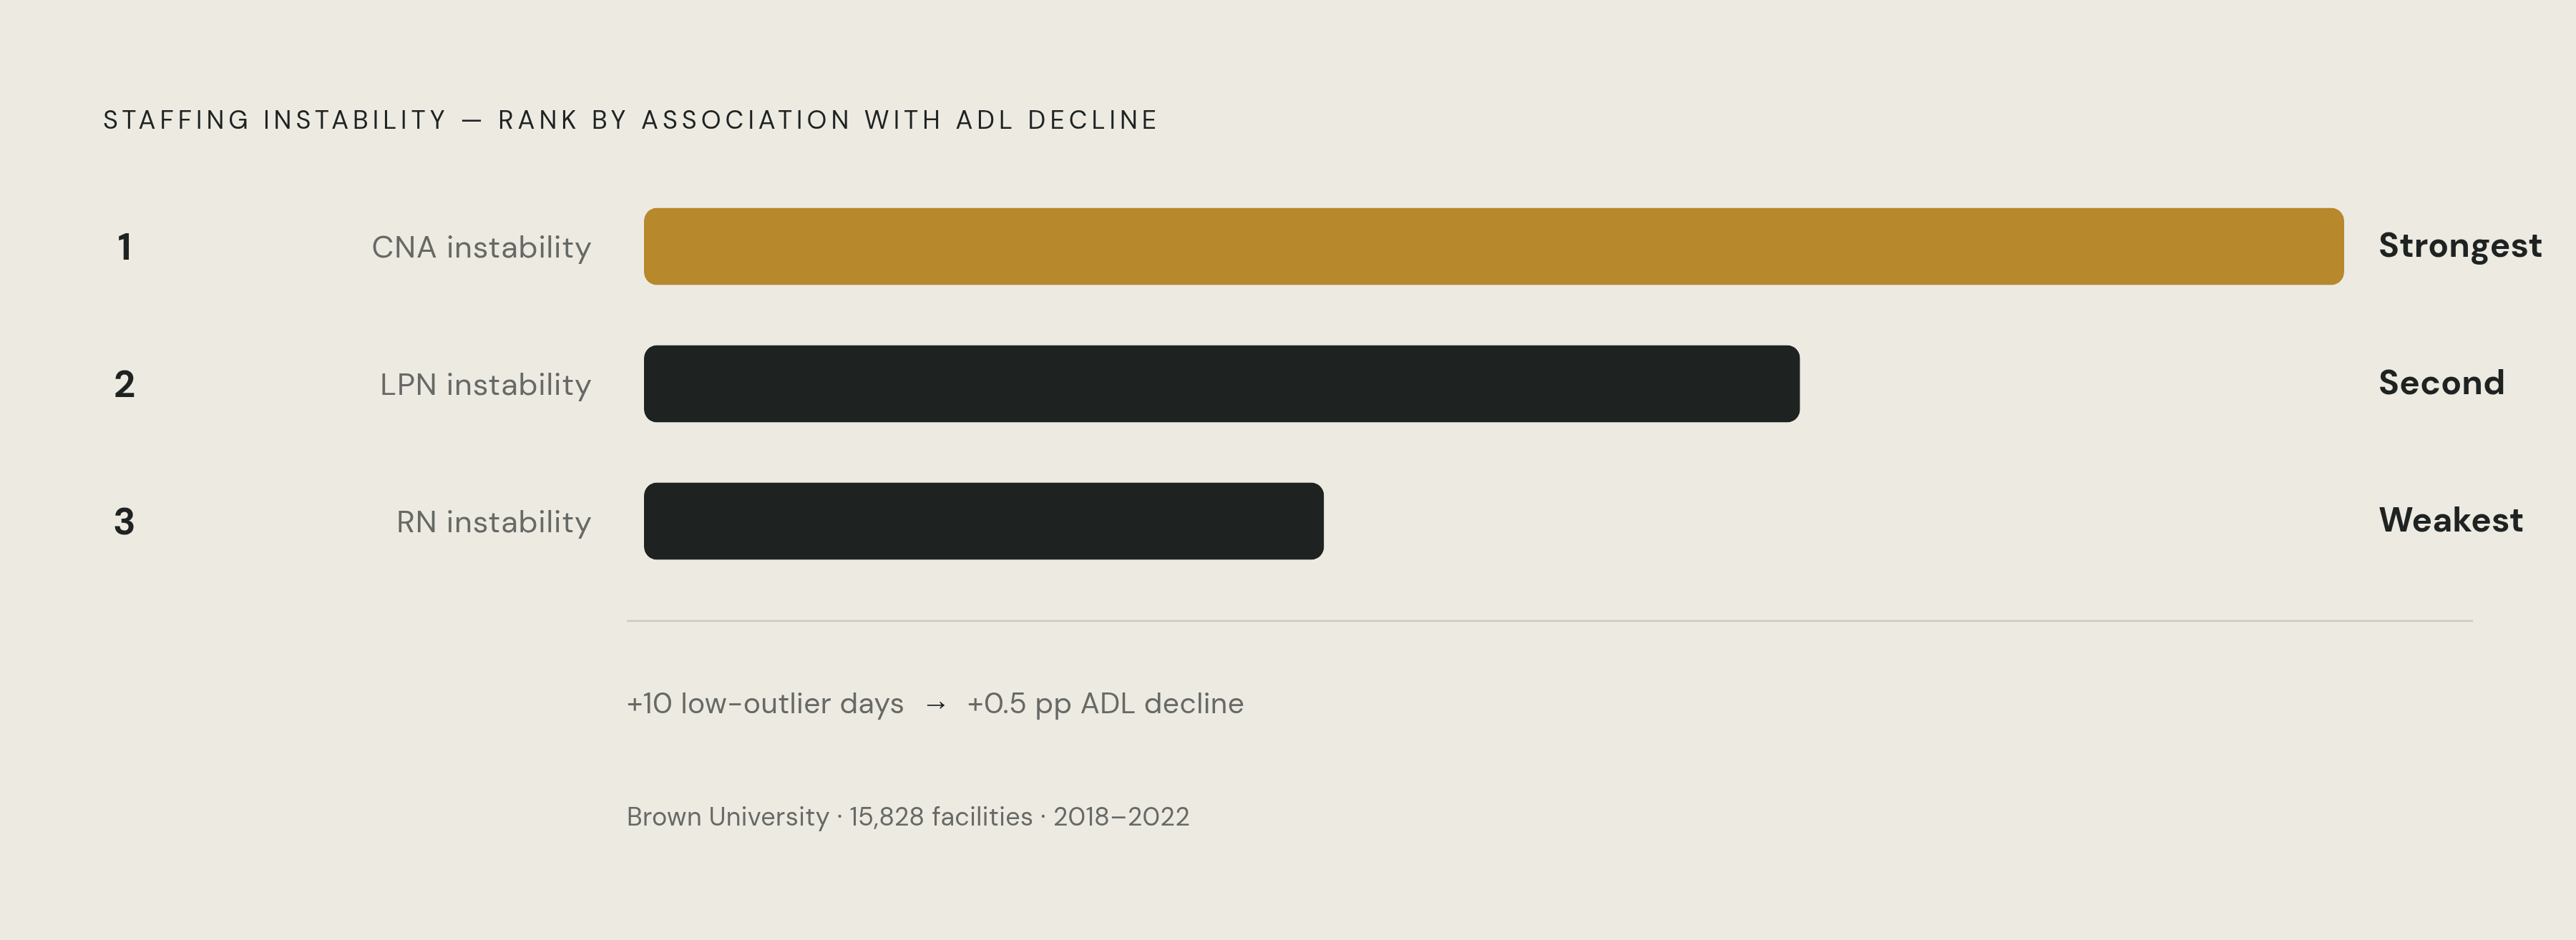
Functional decline tells a more granular story, and it's the one that should actually change how a facility watches its own schedule. Researchers at Brown University linked PBJ shift data to MDS clinical assessments across 15,828 facilities from 2018 through 2022, focusing on "low outlier days," meaning days when direct care hours fell at least 20 percent below a facility's own quarterly average. A 10-day increase in those low outlier days tracked with a 0.5 percentage point rise in ADL decline, along with smaller but statistically significant increases in worsened mobility, weight loss, and pressure ulcers (p<.001). The strongest link wasn't to RN instability. It was CNA instability that drove the effect, which lines up with how directly CNAs handle feeding and mobility, day in and day out. LPN instability came second, RN instability last. Because the comparison runs against each facility's own quarterly mean rather than a national benchmark, this is a signal about internal consistency.
Total hours and staff mix are not the same lever, and confusing them is where most staffing plans go wrong. A 2026 fixed-effects panel analysis published in BMC Nursing, drawing on PBJ and Care Compare data from the fourth quarter of 2018 through the second quarter of 2025, held total HPRD constant and still found that a 10-percentage-point increase in RN share of total hours was associated with lower hospitalization rates (β = -0.800, 95% CI -1.368 to -0.232). A facility can hit its HPRD target and still have the wrong people on the floor. Chasing the total number while ignoring who makes it up is how a building stays compliant and still gets residents hurt.
A data quality problem that distorts the whole analysis
None of this holds up if the incident data feeding it is bad, and there's real reason to think a lot of it is.
McCloskey and colleagues reviewed 898 staff incidents across five long-term care facilities and found that education on what actually counts as a reportable incident, paired with stronger enforcement of reporting procedures, is needed just to get the data to a usable baseline. Two different incident populations can easily be conflated: resident adverse events like falls, pressure injuries, medication errors, and behavioral incidents, against staff injury incidents like musculoskeletal strain from resident handling or needle sticks. These have different causes and different staffing correlates. Mixing the two pools, or worse, tracking only one, produces pattern analysis that looks clean and means very little.
The same study produced a genuinely counterintuitive result: staff incident timing showed no association with periods of high staff-to-resident contact. The obvious assumption says more contact means more opportunity for something to go wrong. That assumption didn't hold up, and only systematic review caught the failure. Gut instinct about when incidents cluster is often wrong, which is the argument for running a system-wide review instead of trusting a hunch about the busy shift.
Under-reporting compounds the problem, and it isn't random noise. Facilities with the weakest reporting cultures tend to have the highest actual incident rates, not the lowest. A facility that looks like it has low staffing and low incidents might just have low staffing and poor documentation, and treating that pairing as a clean correlation will steer an administrator toward exactly the wrong conclusion.
How to build the staffing-incident cross-reference in practice
The infrastructure for this analysis already sits in most facilities, even if no one is using it this way yet.
Section 6106 of the Affordable Care Act requires facilities to submit direct care staffing data, including agency and contract staff, through the Payroll-Based Journal, based on payroll and other auditable records. Paired with census data, PBJ reports staffing levels, turnover, and tenure by category: RNs, LPNs, and CNAs. Each category maps to a different incident risk profile in the research above. The data needed for this cross-reference sits in a system most facilities already file to every quarter.
The method Brown University used, linking PBJ shift data to MDS clinical events at scale, is the rigorous, large-sample version of something a single facility can approximate with its own records. Three things need pulling apart and tracking separately, and none of them should get folded into a single average.
Shift timing comes first: which shifts, night, weekend, holiday, concentrate incidents relative to the staffing level on that specific shift, not the facility's daily or quarterly average. Staff composition comes second: the mix of nursing roles at different skill levels on the shifts where incidents actually happened, given what the skill-mix research shows about hospitalization risk. Staffing instability comes third: low outlier days, defined the way Brown University defined them, as shifts where direct care hours drop at least 20 percent below the facility's own quarterly mean. That last measure is calculable right now from existing PBJ submissions, with no new documentation required.
Where staffing gaps concentrate
Night and weekend shifts carry the sharpest deficits, and this is where the 24/7 RN coverage requirement has always been hardest to clear. Roughly one in four rural facilities still lean on on-call RN coverage overnight rather than someone physically present on the floor. Those are the hours when the skill-mix gap runs widest, and when a resident's early deterioration is least likely to get caught before it turns into a hospital transfer.
Agency and contract shifts introduce a related but distinct problem. A Swiss longitudinal study found temporary staff usage climbed from 5.5 percent of shifts in 2018 to 17.7 percent by 2023, largely as facilities scrambled to cover rising absences. Agency staff fill the schedule, but they don't restore continuity of assignment, and continuity is the actual mechanism connecting staffing instability to outcomes in dementia residents specifically.
That population deserves its own line. The Brown University data showed CNA instability, not RN instability, as the strongest driver of functional decline among residents with dementia. That tracks with how these residents communicate distress or need: through behavioral cues and routine, both of which go unread by staff who don't know the resident. A different CNA on the floor every shift isn't a neutral substitution, whatever the staffing ratio on paper says.
McCloskey's review found staff incidents clustered most heavily in resident rooms, the most private, least observed setting in the building. Resident adverse events likely follow the same spatial logic, which argues for closer attention to what happens in rooms specifically during the thinnest-staffed shifts, rather than leaning on hallway or common-area observation alone.
How the regulatory environment rewards continuous analysis
CMS rolled out the Risk-Based Survey (RBS) process nationwide on September 8, 2026. About 12 percent of nursing homes currently qualify. Facilities that do get a streamlined survey process, along with a high-performing facility icon on Nursing Home Care Compare, visible to every family searching for a placement.
Eligibility runs on overall quality ratings, staffing performance, accuracy of data reporting, and survey history, and every one of those is shaped directly by the kind of staffing-incident analysis described above. Eligibility isn't a badge a facility earns once and keeps, either. A complaint, a facility-reported incident, a survey citation, a staffing waiver, a change in ownership: any of these can knock a facility off the quarterly list. RBS status is a continuous monitoring obligation, not a one-time achievement, which is exactly the discipline this kind of cross-referencing is built to support.
Not everyone backs the framework itself. Critics have raised concerns that a lighter survey process may allow real quality problems to slip through, and that a public-facing icon risks misleading the families relying on it to make a placement decision. That critique deserves a hearing, but it doesn't change what the incentive structure now rewards: facilities that can already show their staffing-incident work is continuous.
Turning the cross-reference into a forward-looking management tool
The Brown University researchers argued that reducing day-to-day instability deserves to stand as its own quality improvement target, separate from simply adding more staffing hours. Stabilizing assignments functions as a clinical intervention in its own right, and the data backs that framing over the alternative of just buying more hours and hoping the mix sorts itself out.
Continuous monitoring, in practice, looks like a short list of habits rather than a new department. Track low outlier days, shifts where direct care hours fall more than 20 percent below the facility's own quarterly mean, as a running early-warning signal pulled straight from PBJ data already on file. Map incident clusters back to shift type, staff category, and coverage ratio instead of reviewing each incident as its own isolated event. Watch RN share of total nursing hours as a separate number from total HPRD, since the panel data shows skill mix associated with hospitalization risk even when total hours are held constant.
There's a layer of data most facilities aren't using yet, and it sits closer to the resident than any staffing report ever will. Incident reports capture what already went wrong. Nurses' day-to-day documentation in the EHR, behavioral changes, appetite shifts, skin assessments, mobility notes, often carries the early signal of a problem before it becomes a reportable event. Pulling structured patterns out of that unstructured, ongoing documentation is the logical next step past PBJ-based analysis, though it demands more from a facility's data systems than checking a staffing ratio does.
For a nursing manager, the argument here is practical as much as clinical. The same cross-reference that reveals risk in the data also buys back time. Instead of reconstructing what went wrong after the fact, ahead of a survey, a manager working from a continuous incident-staffing map can point attention at the shifts, the residents, and the staff configurations where risk is building right now, before any of it turns into an incident report.
Sources
- Linking Incidents in Long-Term Care Facilities to Worker Activities - Rose McCloskey, Cindy Donovan, Alicia Donovan, 2017
- Daily staffing trends and variation in Swiss long-term care from 2018–2023: A retrospective longitudinal analysis
- Staffing Instability and Functional Decline in Long-Stay Nursing Home Residents with Dementia
- Registered nurse staffing intensity, skill mix, and acute-care use among long-stay nursing home residents: a fixed-effects panel analysis
- cms.gov